


Slide 1
Slide 2
Slide 3
Slide 4
Slide 5
Slide 6
Slide 7
Slide 8
Slide 9
Slide 10
Slide 11
Slide 12
Slide 13
Slide 14
Slide 15
Slide 16
Slide 17
Slide 18
Slide 19
Slide 20
Slide 21
Slide 22
Slide 23
Slide 24
Slide 25
Slide 26
Slide 27
Product List
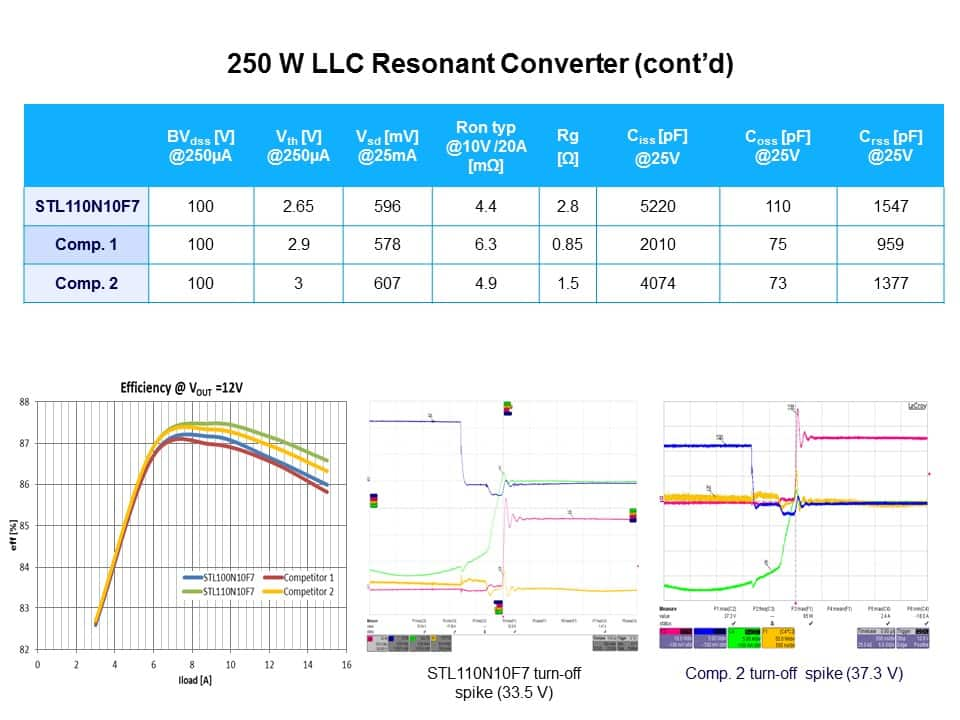

This slide reviews an application comparison in an LLC resonant converter in which the ST device again compares favorably. In the graph on the lower left side, the green and blue lines indicate the performance of the ST F7, the competitors’ traces are the red and yellow lines. The competition’s turn-off spike is quite significant, with peaks of close to 40 volts and 57 volts respectively, which is not a healthy situation for the application.
PTM Published on: 2015-03-24

 中国
中国