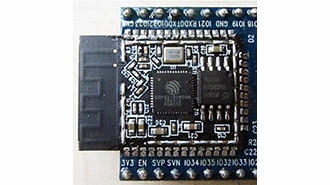
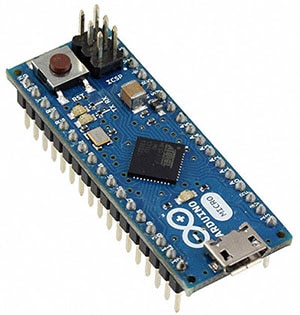
制造商零件编号 ESP32-S3-DEVKITC-1-N32R8V
ESP32-S3-WROOM-2-N32R8V DEV BRD
Espressif Systems
Debugging is incredibly useful, as it allows us to identify and resolve issues in code and hardware. For developers working with the Zephyr RTOS, OpenOCD and GDB offer powerful tools for low-level debugging. OpenOCD provides the interface between the ESP32's JTAG hardware and the debugging software, while GDB serves as the command-line debugger that lets you inspect and control your application during runtime. Together, they enable developers to step through code, set breakpoints, and examine the system's state, ensuring precise control over the debugging process.
In this tutorial, we’ll guide you through the steps to set up and use OpenOCD and GDB to debug an ESP32 running Zephyr. We’ll start by configuring your development environment and connecting your hardware, then walk you through launching OpenOCD, attaching GDB, and using key debugging commands. By the end, you’ll have a clear understanding of how to use these tools to troubleshoot your Zephyr-based ESP32 projects effectively, saving you time and frustration during development.
All code for this Introduction to Zephyr series can be found here: https://github.com/ShawnHymel/introduction-to-zephyr

Important! Disconnect the USB cable from the UART port on the ESP32-S3 board and connect it to the USB port.

For Windows users: you will likely need to install a custom USB driver. Download and run Zadig (you might need to run it as an administrator). Click Options > List all devices. Select the USB JTAG/serial debug unit (Interface 2) from the device drop-down menu. Click the drop-down arrow on the button and select Install Driver. Click the Install Driver (or Reinstall Driver) button.


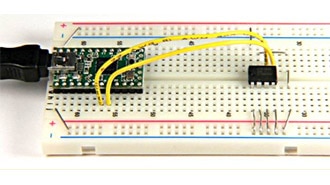
For many microcontrollers, you would need to purchase additional hardware for on-chip debugging. However, the ESP32S3-DevKitC development board includes such, which means we can start debugging right away. This hardware debugger connects to the ESP32 via JTAG and interfaces with your development environment through a USB connection (the “USB” port on the development board).
The “UART” port, which we have been using, is connected to a USB-to-UART chip for uploading firmware and serial debugging. You cannot use it for step-through debugging.
Our host computer runs our development environment. OpenOCD acts as the intermediary between the hardware debugger and the debugging software, translating debugging commands into JTAG operations. GDB, running in our Docker container, provides a user-friendly command-line interface for controlling the debugging session. Developers can use GDB to step through their Zephyr application code, set breakpoints, inspect variables, and analyze system behavior in real-time. We can also connect GDB to VS Code to do such debugging in a graphical environment. This combination of hardware and software creates a seamless workflow, enabling precise debugging of embedded applications.
We are going to use the blink demo from the first episode as an example to demonstrate step-through debugging. In the Docker container, build the blink example:
cd /workspace/apps/01_blink
west build -p always -b esp32s3_devkitc/esp32s3/procpu -- -DDTC_OVERLAY_FILE=boards/esp32s3_devkitc.overlay
On your host computer, upload the demo to your board (change
python -m esptool --port " " --chip auto --baud 921600 --before default_reset --after hard_reset write_flash -u --flash_size detect 0x0 workspace/apps/01_blink/build/zephyr/zephyr.bin
Note: in most cases, GDB and OpenOCD can flash binaries to your board. However, this becomes difficult (or impossible) when working with GDB in a container. For now, we will flash the binary file from the host computer and use GDB from within the container. Keep that in mind when you are making changes to the program you wish to debug.
OpenOCD, short for Open On-Chip Debugger, is an open-source tool that bridges the gap between your development environment and the physical debugging hardware of an embedded system. It provides a standardized interface for interacting with microcontrollers using debugging protocols like JTAG or SWD. OpenOCD is highly versatile, supporting a wide range of microcontrollers and development boards, including the ESP32. By translating high-level debugging commands into low-level operations, OpenOCD allows developers to control and inspect their target devices during runtime. Whether you’re stepping through code, setting breakpoints, or analyzing peripheral registers, OpenOCD plays a vital role in enabling efficient and effective debugging workflows for embedded systems.
Use your operating system’s package manager to install OpenOCD or download the binary here. Note that you must use at least version 0.12.0, as that includes ESP32 support. Note that Espressif maintains a forked version of OpenODC (here), but we will use the official version now that it has ESP32 support.
On Windows, I recommend copying the xpack-openocd-x.x.x directory to your Program Files directory. You will then need to add that folder to your PATH. Go to Control Panel > System and Security > System > System tab > About > Advanced System Settings > Advanced tab > Environment Variables. Select Path under User variables and click Edit. Add the path to your xpack-openocd-x.x.x directory. You should now be able to call the openocd command from a terminal.
Open a terminal (on your host machine) and run OpenOCD with the ESP32S3 configuration file:
openocd -f board/esp32s3-builtin.cfg
This should connect to the on-chip debugging hardware on your ESP32 board and start listening on port 3333 for a GDB connection.

GDB, the GNU Debugger, is a powerful command-line tool designed to help developers debug and analyze programs during runtime. It provides deep insight into the execution of applications, allowing you to step through code, inspect variables, modify memory, set breakpoints, and analyze system state when crashes or unexpected behavior occur. GDB supports a wide range of programming languages and architectures, making it a versatile tool for embedded development. When paired with OpenOCD, GDB enables seamless debugging of embedded systems like the ESP32, giving developers precise control over their applications running on real hardware. With its rich feature set, GDB is an indispensable tool for diagnosing and fixing issues in complex software systems.
Zephyr, where possible, includes GDB variants for its supported embedded systems (such as the ESP32 series). The ESP32S3 GDB is located at /opt/toolchains/zephyr-sdk-0.16.8/xtensa-espressif_esp32s3_zephyr-elf/bin/xtensa-espressif_esp32s3_zephyr-elf-gdb. You will need to supply the associated .elf file when running GDB, as it includes symbol information that connects the machine code to our human-readable C code.
In the Docker container, run GDB with:
/opt/toolchains/zephyr-sdk-0.16.8/xtensa-espressif_esp32s3_zephyr-elf/bin/xtensa-espressif_esp32s3_zephyr-elf-gdb build/zephyr/zephyr.elf
You will be presented with a prompt in the terminal. We can interact with GDB using this text-based prompt and the commands (detailed in the GDB documentation). I also recommend checking out Beej’s Quick Guide to GDB.
Here are some functions to help you get started:
target remote host.docker.internal:3333
monitor reset run
mon reset halt
continue
mon reset halt
break main
break main.c:30
break main.c:33
info breakpoints
delete 3
break main.c:39
continue
print state
print sleep_time_ms
info locals
x /1x 0x60004004
list
step
next
finish
backtrace
continue
x /1x 0x60004004
detach
exit
In /workspace/.vscode/launch.json, add the following (if you are using the pre-made Docker image, this should already be present):
{
    "configurations": [
        {
            "name": "Debug ESP32-S3",
            "type": "cppdbg",
            "request": "launch",
            "program": "${input:elfPath}",
            "args": [],
            "stopAtEntry": true,
            "cwd":  "${workspaceFolder}",
            "MIMode": "gdb",
            "miDebuggerPath": "/opt/toolchains/zephyr-sdk-0.16.8/xtensa-espressif_esp32s3_zephyr-elf/bin/xtensa-espressif_esp32s3_zephyr-elf-gdb",
            "miDebuggerServerAddress": "host.docker.internal:3333",
            "setupCommands": [
                {
                    "description": "Pretty print for gdb",
                    "text": "-enable-pretty-printing",
                    "ignoreFailures": true
                }
            ]
        }
    ],
    "inputs": [
        {
            "id": "elfPath",
            "type": "promptString",
            "description": "Enter the path to the ELF file",
        }
    ]
}
This adds a configuration for debugging the ESP32-S3 using GDB in VS Code. Here is a breakdown of the components:
This configuration integrates GDB with OpenOCD to debug an ESP32-S3 program. It ensures the ELF file path is dynamically provided, connects to the OpenOCD server via Docker, and enables essential debugging features such as stopping at the program's entry point and pretty-printing for improved variable inspection.
Click on the Run/Debug icon on the left side of VS Code. That should open a new pane. At the top, select the Debug ESP32-S3 (/workspace) configuration (which we created with the launch.json file).

If you do not see the Debug ESP32-S3 option, you can press Ctrl+Shift+P to bring up the command palette and enter “Developer: Reload Window” to reconnect to the Docker container.
Press the green Debug button next to Debug ESP32-S3 to start the debugging process. When asked, provide the path to the .elf file: /workspace/apps/01_demo_blink/build/zephyr/zephyr.elf. At this point, the debugger should connect to OpenOCD and start a debugging session.
You can use the graphical buttons to run, pause, step over, step into, step out of, restart, and stop execution. You can also set breakpoints by clicking to the left of the line number and peek at variable values by hovering your mouse over the variable name in the code. That is only the basics–VS Code has many more debugging capabilities. See this guide to learn more.

Your challenge is to get the print functions (e.g., printk(), printf()) working from the USB port on the ESP32-S3-DevKitC instead of the UART port. While not strictly a debugging challenge, it allows you to continue working with the DeviceTree, and it gives you the option of using the USB port for the rest of the series (if you wish).
Hint: look at the chosen node in zephyr/boards/espressif/esp32s3_devkitc/esp32s3_devkitc_procpu.dts.
Note that for the rest of the series, I will go back to the UART port, but you are welcome to use the USB port if you wish.
The solution for this challenge can be found here: https://github.com/ShawnHymel/introduction-to-zephyr/tree/main/workspace/apps/08_solution_sensor_queue
Debugging is crucial for troubleshooting issues during software (and firmware development). Serial printing works well for most basic applications, but sometimes you need to dive a little deeper. The ability to set breakpoints, step through lines of code, and peek at memory values is crucial for debugging tricky issues with complex code. Zephyr relies on OpenOCD and GDB (for most supported boards) for such advanced debugging.
To learn more about debugging in Zephyr (as well as OpenOCD and GDB), I recommend the following content: