


Slide 1
Slide 2
Slide 3
Slide 4
Slide 5
Slide 6
Slide 7
Slide 8
Slide 9
Slide 10
Slide 11
Slide 12
Product List
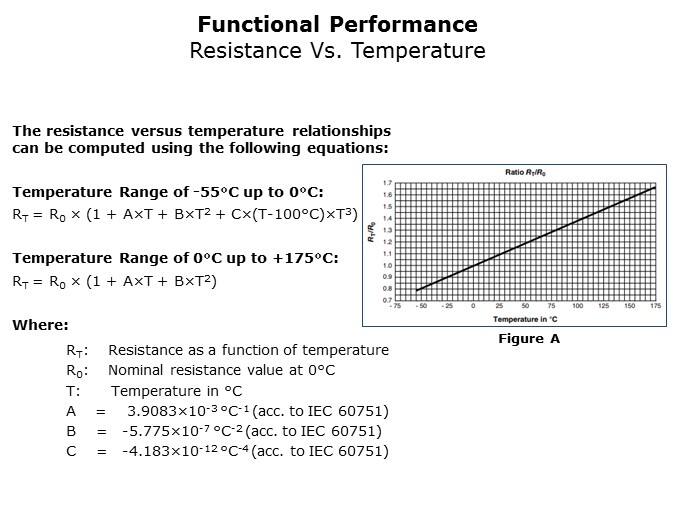

The nearly linear resistance versus temperature relationship for the PTS AT sensor is accurately modeled using the set of equations outlined here (temperature range dependent) with the known values (R0, T, A, B, C). R0 represents the nominal resistance at 0°C, T represents temperature in °C and A, B, and C represent the Callendar-Van Dusen constants that are derived from actual resistance measurements in accordance with IEC 60751. Figure A shows a graph of the R vs. T relationship (RT/R0 ratio versus temperature). A more detailed table outlining the R vs. T relationship can be found in the PTS AT datasheet.
PTM Published on: 2018-04-09


 中国
中国