How to Simplify the Test of CAN Bus Networks Using the Right Oscilloscope
In-vehicle networks (IVNs) allow microcontrollers and engine control units (ECUs) to communicate with sensors, actuators, indicators, displays, and each other. One of the classic IVNs is the controller area network or CAN bus. CAN has been around for about thirty years, but it continues to develop.
The classic CAN bus, as described in the ISO11898 standard, operates at data rates of up to 1 megabit per second (Mbps) and handles medium-bandwidth requirements using a single twisted pair. The CAN bus, like all active networks, continues to develop to meet the needs of the industry. For example, CAN flexible data rate (CAN FD) increases the data rate to 5 Mbps. The latest CAN standard is CAN extra-long (CAN XL), and it operates at up to 10 Mbps or more; both are backward compatible with classic CAN.
The physical layer (PHY) wiring for a CAN network consists of twisted-pair wiring between CAN nodes (Figure 1).
 Figure 1: The CAN network is wired with terminated twisted-pair cabling, and nodes are drop-connected. Each node has a CAN transceiver and a microcontroller unit (MCU) with a CAN controller function. (Image source: Texas Instruments)
The bus wiring of the CAN network requires 120 Ohm (Ω) terminations at both ends of the bus to minimize reflections. Bus rates depend on the CAN implementation and are affected by the actual length of the network. The longer the network, the lower the maximum data rate it can sustain. The 1 Mbps data rate is for a network length of 40 meters (m) or less.
Communication is differential using the two wires in the twisted pair, designated CANH and CANL; the CAN transceiver driver is required to achieve a 1.5 volt differential signal across the 60 Ω differential load of the terminated twisted pair. The signal levels are referred to as dominant and recessive. The dominant or ‘1’ level has a differential voltage level greater than or equal to 0.9 volts. The recessive or ‘0’ level has a differential voltage of less than 0.5 volts (Figure 2).
 Figure 2: Shown are the differential signal definitions for the CAN bus CANH and CANL conductors. (Image source: Texas Instruments)
The bus driver is capable of actively driving the bus to the dominant state, while the return to the recessive state depends on resistive discharge through the terminations. It also allows a dominant bit to overwrite a recessive bit state. This feature is used for acknowledgment and bus arbitration.
Testing the CAN bus
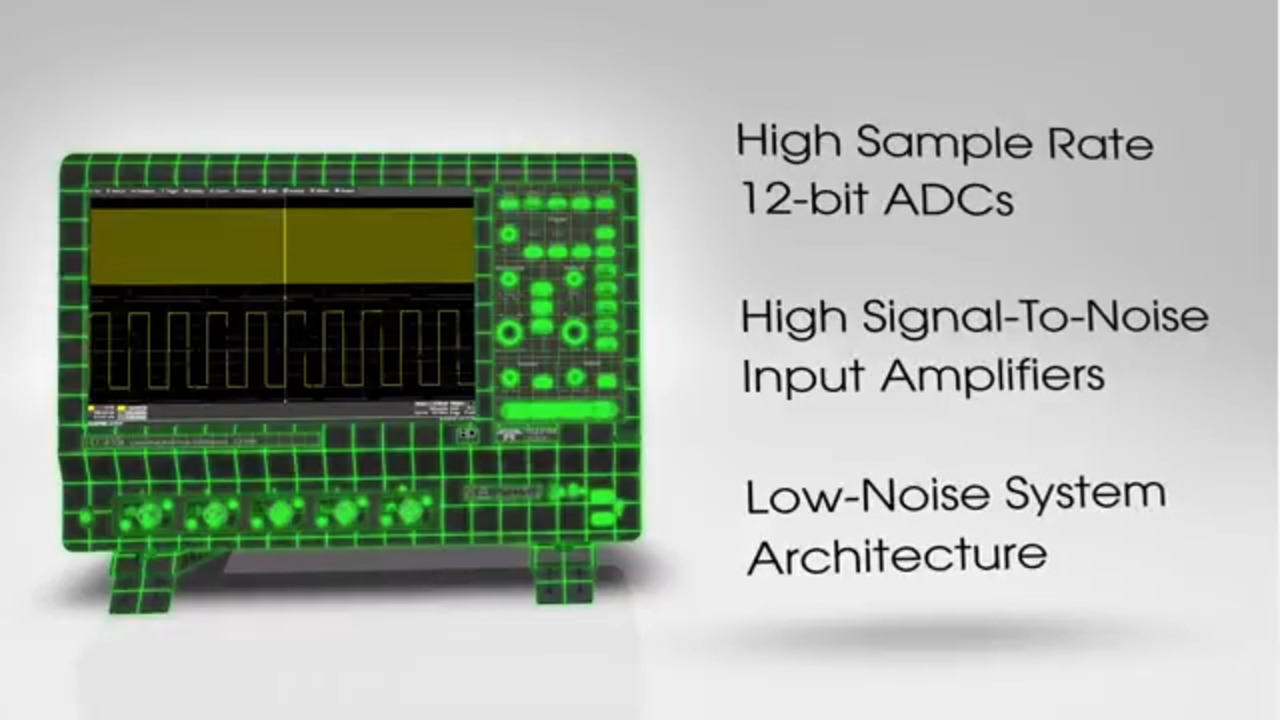
You can test the PHY of the CAN bus using an oscilloscope. Make sure that the bandwidth of the oscilloscope and associated probes is roughly five times the clock rate of the serial data signal. If we consider the full range of CAN bus data rates, the maximum rate is 20 Mbps for the data field of CAN XL. That indicates we should use an oscilloscope with a bandwidth of over 100 megahertz (MHz). Let’s go with the Teledyne LeCroy model HDO4024A, a four-channel oscilloscope with a bandwidth of 200 MHz.
Connecting to the CAN bus
Connect the oscilloscope to the CAN bus using probes. Two of the 10:1 high-impedance probes—supplied with the oscilloscope—can be used. This allows viewing of both the differential components, CANL and CANH. To view the differential signal, the oscilloscope’s difference math function is used to subtract CANL from CANH (Figure 3).
 Figure 3: CANH (top trace), CANL (center trace), and the differential CAN signal (bottom trace). The differential signal is calculated using the oscilloscope’s difference math function. (Image source: Teledyne LeCroy)
A better approach is to use a differential probe like the Teledyne LeCroy ZD200. The ZD200 has a bandwidth of 200 MHz, a differential voltage range of ±20 volts, and a common-mode range of ±60 volts. The probe has two inputs: the non-inverting (+) input is connected to CANH, while the inverting input (-) is connected to CANL. Because we’re using the differential probe, only a single oscilloscope channel is required (Figure 4). This shows a CAN signal with a duration of 100 milliseconds (ms) with about 20 messages. On the bottom is a horizontally expanded zoom trace that shows a single message from the longer acquisition.
 Figure 4: Shown is a 100 ms duration CAN signal with about 20 messages acquired with a differential probe. A horizontally expanded zoom trace (bottom) shows a single message from the longer acquisition. (Image source: Art Pini)
Another advantage of the differential probe is that it also attenuates any noise or transients common to both inputs to improve the signal-to-noise ratio (SNR) of the measurement. This is especially important in an electrically noisy vehicle environment.
CAN protocol
The CAN bus messages follow a standardized protocol that allows the network to address data and commands where needed (Figure 5).
 Figure 5: The CAN protocol provides a structure for transferring data across the bus and verifying that it is received. It also provides error checking. (Image source: Texas Instruments)
In the context of CAN bus, the Teledyne LeCroy oscilloscope has a very useful option you will appreciate: CAN and CAN FD trigger and decode software. The HDO4K-CAN BUS TD oscilloscope software works with the classic CAN network, while the HDO4k-CAN FD TD option works with the CAN FD bus. These options allow the oscilloscope to trigger on specific CAN message content, including message ID, ID plus data content, remote messages, error events, or all messages. The primary function is to decode the messages—just like a protocol analyzer (Figure 6).
 Figure 6: The HDO4K-CAN BUS TD CAN trigger and decode option reads the CAN message and displays it with a color-coded overlay to indicate the different fields and their content. (Image source: Art Pini)
Each message field is identified by a specific color overlay as well as a text label. Each message is also listed in the accompanying table located beneath the waveform display. Clicking on any entry in the table will cause the associated waveform to be displayed in the zoom trace for closer examination.
Clicking on the table heading allows the user to search or filter the table entries for specific conditions within the field and display only those of interest. For example, by selecting the ID field, only entries with a specific ID or range of IDs are shown.
By selecting symbolic viewing, the oscilloscope will use an industry-standard Database CAN (DBC) file to translate the hex field entries into plain-language text describing each field (Figure 7).
 Figure 7: Symbolic decoding translates the raw hex data into plain text to help interpret the data contained in the CAN message. (Image source: Art Pini)
For example, the message content for the engine coolant is expanded to show the data includes the coolant temperature, pressure, and level.
The decode option also indicates the presence of stuff bits. If the bit sequence contains five or more bits of the same state, then the controller will insert a stuff bit of the opposite state to ensure that there are sufficient edges in the signal to maintain synchronization. These stuff bits are removed by the receiver so that the data content is correct. Both previous figures show these stuff bits with the label SB.
Conclusion
Though well established, CAN bus continues to evolve and adapt to meet the needs of the automotive engineer. So too, have oscilloscopes. Designers can use an oscilloscope equipped with appropriate probes and with optional trigger and decode software as an effective tool to simplify the testing and fault finding of CAN bus networks.
关于此作者

Arthur (Art) Pini 是 DigiKey 的特约作者。他拥有纽约城市学院的电气工程学士学位和纽约城市大学的电气工程硕士学位。Art 在电子领域拥有超过 50 年的经验,曾在 Teledyne LeCroy、Summation、Wavetek 和 Nicolet Scientific 担任重要工程和营销职位。Art 对测量技术很感兴趣,在示波器、频谱分析仪、任意波形发生器、数字化仪和功率计方面有着丰富的经验。

Have questions or comments? Continue the conversation on TechForum, Digi-Key's online community and technical resource.
Visit TechForum
此作者发布的其它博客