In-Circuit Emulators Provide Advanced MCU Problem Analysis and System Evaluation
投稿人:电子产品
2013-09-11
In-circuit emulators (ICEs) are effective tools that provide MCU designers with the ability to debug code and exercise hardware. In the past, these were large, expensive, complex tools that were often cumbersome to learn and use. They came with their own umbilical connections that actually replaced the microcontroller on the target board with a bonded-out version that allowed an added wrapper of real-time control.
With the almost universal use of surface-mount devices, this is no longer a feasible approach. Virtually every microcontroller supplier supports in-system programming, as well as debug and emulation functionality. Debug hardware incorporated into today’s microcontrollers, coupled with the use of debug serial buses like USB and JTAG, allows design engineers to test firmware and hardware in a less-intrusive and lower-cost way. Giving the engineer access to all internal MCU resources also reduces the critical time-to-market cycle.
This article looks at some microcontroller debug and test systems and approaches that perform ICE and ICE-like functions for debug and development of embedded systems. All parts, datasheets, tools, software, app-notes, training, and development kits referenced here are available on the DigiKey website.
Legacy facelift
As design engineers can attest, an MCU can remain truly backward compatible while still undergoing feature enhancements and performance improvement. One legacy architecture receiving some silicon surgery was the Atmel AT89C51 family. Based around the older but still quite popular 8051 architecture, these parts have added modern peripherals like CAN, USB, SPI, and smart-card interfaces. In addition, larger amounts of Flash and RAM (up to 128 K and 8 K), and mixed signal functionality (10-bit A/D converters) have enabled these older architectures to meet current design requirements.
Key to their continuing utility is in-system programming and emulator support using the AT89OCD-01 USB emulator (Figure 1). Powered by the USB port, the emulator and Windows software allows designers to partition memory areas and special-function registers into customizable displays. This helps designers keep visual tabs on all the important parts of the microcontroller and debug specific functions and code blocks.
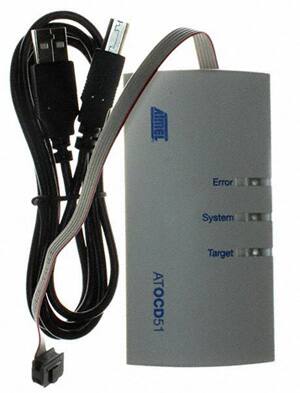
An “unlimited” number of software breakpoints and trace buffers can be started and stopped through user-defined triggers. The Atmel emulator also supports other standard debug and trace features like stepped operations and hardware breakpoints on memory locations, special-function register updates, and RAM accesses (internal and external). Of course, it also supports code download and sleep mode for debugging low-power designs.
Note that this tool works with the Java runtime environment and Keil µVision 2 or 3 software development tools to allow seamless transition from code writing to debug and testing. A small 6-pin connector on the target board is all that is needed to connect your PCB with the development and support tools (Figure 2). A Product Training Module for the Atmel MCU line is also available.

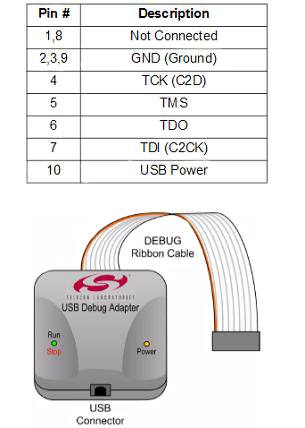
Silicon Labs is also a supplier of modernized 8051 cores and supports its C8051Fxx family with the similar USB-based DEBUGADPTR1-USB, which uses a 10-pin SIP debug cable to communicate with the target microcontroller board through JTAG (Figure 3). To preserve real-timing of the target board during debug operations, the debugger and emulator require a system target clock of 32 kHz or greater.
ARM® support
A huge amount of effort has been going into supporting the ARM family of processors. These popular parts offer a scalable construct of Harvard architecture RISC processors. Every manufacturer of ARM-based MCUs wraps the standardized, compatible cores with its own unique flavors to provide a family of processors rich in feature sets, peripherals, performance, and capabilities.
Most chip manufacturers support third-party compilers and tool suites, as well as debug and programming interfaces. Third-party support comes from compiler suppliers like IAR and Keil, as well as from tool companies such as Segger and Olimex.
The IAR JTAGJET-ARM provides the standard ETM 38-pin connect or the 20-pin Cortex SWD header adapters to support ARM 7, ARM 9, ARM 11, MP, and Cortex cores, to name a few. It supports multicore debugging and trace sampling up to 400 MHz CPU speeds.
Some nice features are its fast code downloads, automatic process initialization, and support for all on-chip breakpoints, triggers, and filtering. It is also Linux and RTOS friendly and supports embedded Linux debugging.
Keil is another major provider of tools and programming compilers and is now part of the ARM group. The company provides the ULINKPRO high-speed debug and trace unit for support of ARM 7, ARM 9, and Cortex cores, which is tightly integrated with its communications stacks and real-time operating system (Figure 4).
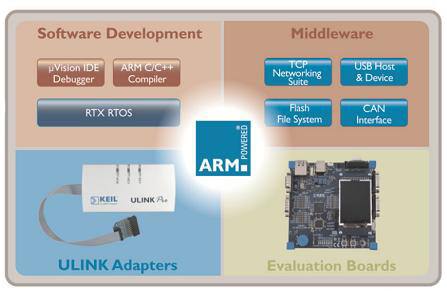
The Keil MDK-ARM is a complete software-development environment combining C/C++ compilers with the company’s deterministic RTX real-time operating system. It requires only a small memory footprint. Middleware libraries for TCP, CAN, USB, and networking provide stacks with standard driver classes, which can be a real time saver. The MDK works with the ULINKPRO to record executed instructions and provide time profiling with complete code coverage.
Segger Microcontroller Systems also supports embedded processor development with tools and middleware libraries, and offers a high-level ARM tool. The 8.16.28 J-LINK ULTRA+ J-Link device is a USB-based J-Tag emulator that supports ARM cores. It uses the standard 20-pin header defined by ARM and provides full-speed USB downloads to Flash for most popular micros.
The emulator supports serial-wire viewer and serial-wire debugger modes where a single I/O provides snapshot images of key register, I/O, and core registers. It should be noted that several micro manufacturers use third-party tools like Segger’s as the development offering on their eval and development kits. It may even be provided free in some form as part of an MCU manufacturer’s toolset.
Off the beaten path
Parts that are not as widely used or that add specialized functionality often also require specialized tools. DSP processors are one example of a specialized processor architecture that fills a needed role.
Analog Devices’ ADZS-ICE-100B is a non-intrusive ICE unit designed to work with the company’s Blackfin® family of DSP processors. It ties together debug and code-watch functionality with the Visual DSP++ design environment to provide the same high-level control and benefits as other emulators and debuggers.
Microchip partners with specialized toolmakers and makes their own development tool suite for more specialized parts. The ICD-U64 from Custom Computer Services is the in-circuit programmer, emulator, and debugger for Microchip’s PIC® and dsPIC parts. This development environment comes with a large library of example programs and C drivers for a variety of serial Flash, sensors, transceivers, and assorted peripheral chips.
Texas Instruments also makes its own tools as well as supports third-party toolsets. An example is the popular but proprietary MSP430 family of devices, which is supported by emulators from both TI and Olimex.
Olimex offers an In Circuit Debugger, Emulator, and Programmer with its MSP430-JTAG-TINY-V2 tool. Likewise, TI provides an embedded debug and programmer tool for the MSP430 designated MSP-FET430PIF.
Summary
Emulators and debuggers have become smaller, less expensive, and more integrated into design and development environments. Small, unobtrusive interfaces allow high-level control, verification, debug, and programming support for legacy as well as popular modern processor architectures and even specialized cores. For more information on the parts discussed in this article, use the links provided to access product pages on the DigiKey website.
免责声明:各个作者和/或论坛参与者在本网站发表的观点、看法和意见不代表 DigiKey 的观点、看法和意见,也不代表 DigiKey 官方政策。




 中国
中国